August 2020
Originally Published in Vol. 20, No. 1, January 2014 Edition of Business Valuation Resources, LLC’s Business Valuation Update
Closed-end fund (“CEF”) data is commonly used to derive discounts for lack of control (“DLOC”) for closely-held holding companies invested in marketable securities. CEFs are the most comparable public proxies to investment-holding companies because both have a limited number of shares available to investors. These shares must be purchased from other investors instead of the fund itself. In contrast, open-ended funds (such as mutual funds) have an unlimited number of shares that may be issued or redeemed. CEFs are traded in the public market and their prices represent minority interests in fully marketable securities. The net asset value (“NAV”) of a CEF can be compared to its freely-traded price to determine whether the market is providing a discount (or premium) to a minority interest.
For larger valuation practices, CEF data is easily obtained through comprehensive databases, such as Bloomberg Professional. However, for smaller firms, which may not be able to justify the cost of a Bloomberg terminal, obtaining historical information on these funds might prove more challenging. As this article was written, we had recently lost access to our primary CEF data source. The Factiva database (maintained by Dow Jones) previously allowed us to select, purchase and download Barron’s Market Week closed-end fund articles; published every Friday, in word processor format for ease of import into spreadsheets for analysis. We also use Morningstar’s Principia database to analyze certain quantitative factors as of the end of each month, including fund size and diversification, but this, too, will be phased out in the coming months. As with many databases, affordable “on-demand” or limited-access databases are being discontinued and replaced with more expensive subscriptions, which provide a great deal more information than most valuation professionals need.
So, where can we obtain CEF data? Here are some suggestions:
- Your local library, of course! Libraries will often have back-issues of Barron’s Market Week or The Wall Street Journal for free. However, this can be a time-consuming endeavor since it requires making a trip to the library, finding the appropriate publication, manually entering data into a spreadsheet, and checking through the data input before the analysis can begin. These publications also have limited quantitative information related to CEFs.
- The Wall Street Journal provides daily CEF data (NAV, market price and 52-week returns) for free online. However, historical data is not available, which makes this almost useless for retrospective valuations.
- Lipper, Inc., a Thomson Reuters company, provides historical CEF data with more than 65 performance and risk calculations. The Lipper database is one of the most comprehensive databases available and provides its data in spreadsheet format.
This article will walk through an analysis of CEFs using data from Lipper. This is not an end-all, be-all example of what to consider when deriving a DLOC from CEFs, but should provide a good starting point for completing a thorough analysis.
Data Presentation
Lipper provides an extensive amount of information for each fund. Some of the data fields that may be relevant to assessing a DLOC are listed below:
- Fund Name
- Ticker
- Fund Classification
- Fund Investment Objective
- Total Fund NAV
- NAV per Share
- Price per Share
- Premium/Discount
- Annualized and 12-Month Distribution Yield
- 12-Month Total Return (Reinvested Dividend and Capital Return)
- Top 10 Holdings Percentage of Total Fund NAV
- Number of Securities in Portfolio
- Fund Leverage as a Percentage of NAV
- Historical 12-Month Trend of Discounts/Premiums
Lipper provides additional data related to measuring performance and risk for portfolio management, including forecasted returns, Jensen’s alpha, Sharpe ratios and a variety of betas, among numerous other factors. They also provide formulas for calculating these measures in “Lipper Investment Management, Lipper Calculations, A Methodology Guide.” In general, many of these measures are not pertinent to deriving a DLOC.
Selecting Closed-End Funds
The first step in deriving a DLOC is the selection of the appropriate CEFs. As of the date this article was written, there were 633 CEFs and Lipper provides data on all of the funds. While it is unlikely to identify a group of funds that exactly mimic the investment portfolio(s) of a closely-held holding company, a group of CEFs with similar assets can be compiled to derive more meaningful conclusions. The objective is to consider CEFs that are most comparable to the subject holding company but retain enough funds to conduct a meaningful analysis.
As an example, let’s assume that an appraiser has been engaged to value Holdco, LLC, which owns more than 20 equity securities in U.S. companies diversified across a relatively wide range of industries. Based on Lipper’s system of classification, the most comparable CEFs would be those that are invested in U.S. domestic equity securities (“USDE”). Seventy-five percent of the USDE funds’ portfolios must consist of U.S. equity securities. In general, funds with portfolios that include 25 percent or more of international equity securities are classified as world equity funds. Lipper makes exceptions to this threshold if a fund is temporarily invested in international equity securities. As of June 30, 2013, there were 38 funds that fit into the USDE category. A list of these funds and their discounts from NAV is presented in Exhibit 1.
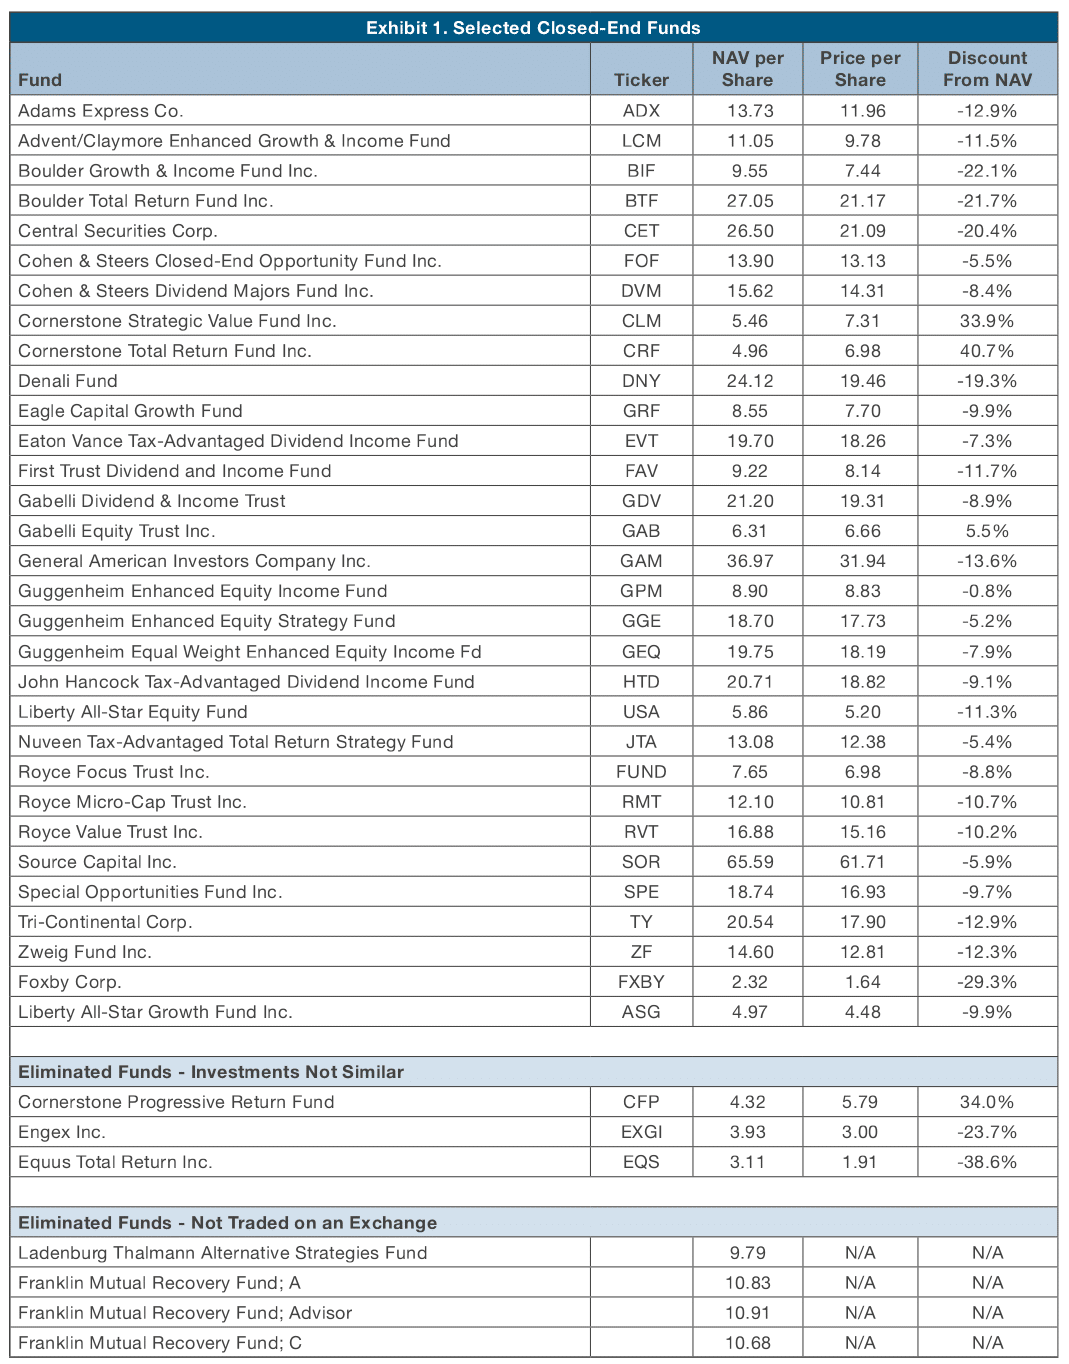
As with most data sources used by valuation professionals, it is not advisable to blindly rely on Lipper’s classification system (or any other database for that matter). Therefore, the final step of the selection process is to ensure the group’s relevance. As can be seen in Exhibit 1, seven funds were eliminated from our analysis. Three funds were eliminated because their investment portfolios were deemed too dissimilar to Holdco, LLC to be comparable:
- Cornerstone Progressive Return Fund – Invests in CEFs focused on diversified and sector-specific U.S. equity and fixed income securities.
- Engex, Inc. – Invests primarily in the biotechnology sector.
- Equus Total Return, Inc. – Nearly 75 percent of its portfolio consists of cash.
The remaining four CEFs are interval funds that are not traded on an exchange and, therefore, were not given further consideration in our analysis. While other eliminations are possible, this should illustrate why funds must be analyzed further before using them to derive a DLOC. For purposes of this article, we will analyze the remaining 31 USDE funds.
Comparative Analysis - Quantitative Factors
The Lipper database allows us to analyze a number of quantitative factors, including yield on NAV, size, leverage, number of investments within the portfolio and diversification. We can attempt to find some relationship between each of these factors and discounts from NAV to determine what DLOC would be appropriate for the subject holding company. One of the more obvious approaches to identifying a relationship between two variables is through the use of a simple linear regression. While this article is not a lesson in statistics, a regression analysis will result in an equation that attempts to predict the value of one variable (the DLOC) based on another variable (a quantitative factor) and the coefficient of determination (better known as R-squared), which indicates how much of the data can be explained by the regression equation. In Exhibit 2, we plotted the discounts and yields for the USDE funds and show the resulting linear regression.
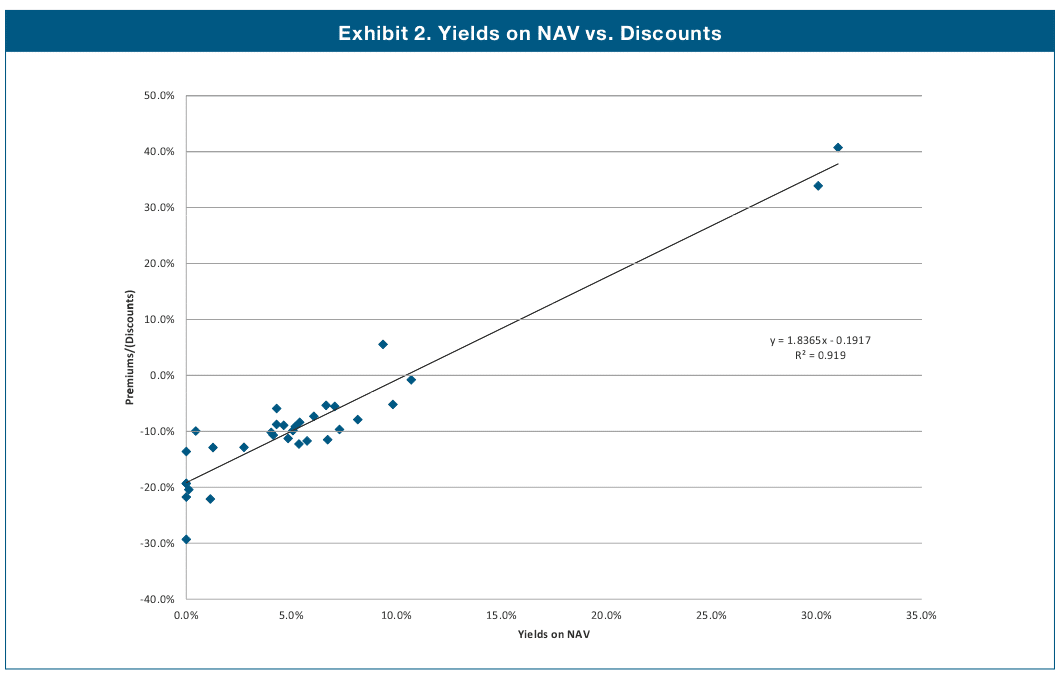
Wow! A 0.919 R-squared! In layman’s terms, 91.9 percent of the data points in Exhibit 2 can be explained by the regression equation. However, it is important to point out that there are two obvious outliers in this dataset. To measure the impact of the outliers on the regression analysis, they were removed and the data was regressed again, as shown in Exhibit 3.
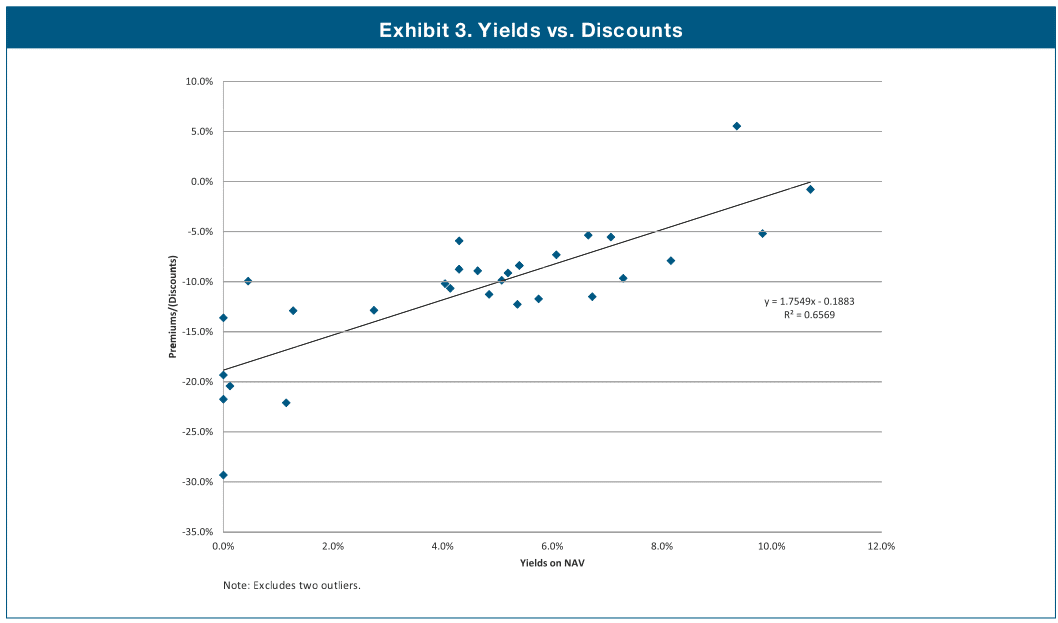
After removing the two outliers, the R-squared has declined to 0.6569. The argument as to whether or not the relationship is statistically relevant is beyond the scope of this article, but it is clear that the relationship is not as clear-cut as it had appeared in Exhibit 2. However, it still appears that the highest yielding CEFs traded at lower discounts to NAV compared to funds that had little or no yield.
There are other ways to identify the existence of a relationship between discounts and the various quantitative factors. If the CEFs are sorted by yield and the discounts separated into quartiles, an appraiser can analyze potential relationships between the two variables. This analysis is summarized in Exhibit 4.
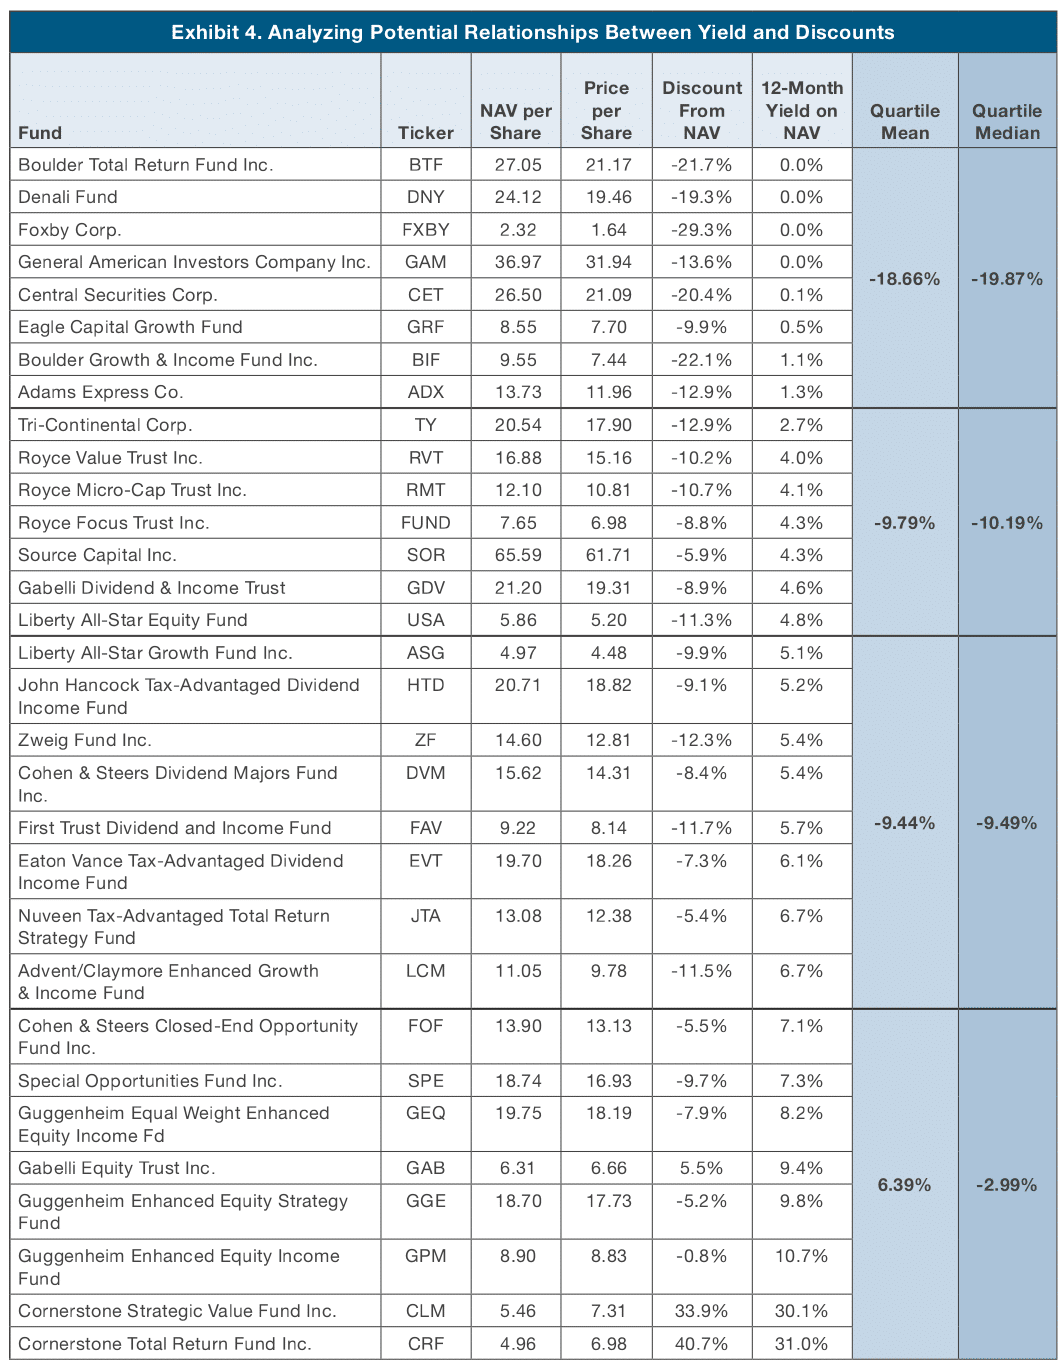
This analysis draws essentially the same conclusions as shown in Exhibits 2 and 3, except without the use of statistics. While there is no meaningful difference between discounts in the middle quartiles, funds with the lowest yields on NAV tended to trade at the highest discounts and CEFs with the highest discounts tended to trade at the lowest discounts or at premiums. There are obvious inconsistencies in this relationship, as some funds with lower yields traded at lower discounts than other funds with relatively high yields. However, the data in Exhibit 4 indicates that there might be some support for adjusting the median or average discount of the CEFs based on the subject holding company’s yield. This type of analysis can be completed for any quantitative factors.
Comparative Analysis - Qualitative Factors
There are a number of qualitative factors an analyst can consider to further support an adjustment to the CEF discounts. Some of these factors include:
- In many cases, a closely-held holding company lacks the breadth of the investment management teams that manage the CEFs.
- While diversification, in terms of top 10 holdings, may be quantitatively explained by the CEF data, it does not necessarily encompass a privately-held holding company’s lack of industry diversification. This might support an increase in the selected DLOC.
- Investors in almost all closely-held holding companies lack the regulatory protections and access to information enjoyed by investors in CEFs and provided by the Securities and Exchange Commission.
- Investment holding companies are often not restricted in the nature of their assets and a minority investor is typically at the mercy of the manager. A manager could potentially sell existing assets to purchase less liquid investments, such as real estate, private equity securities or art.
- CEF discounts and premiums fluctuate with changes in market conditions, particularly with fixed income funds. Consideration of historical trends could be helpful if CEFs are trading at abnormal premiums or discounts.
- Risk factors that are unique to the investments held by the subject holding company might not be accounted for in the CEF discounts and may have an impact on the DLOC.
Any adjustment based on qualitative factors will be subjective and, therefore, must be supported by common sense. In some cases, an adjustment based only on qualitative factors may not be supportable. Instead, these factors can be frequently used in conjunction with a quantitative analysis to support the selection of a DLOC.
Selecting the DLOC
The median and average of the CEF discounts can be used as starting points in developing a DLOC and are perhaps the most frequently used among valuation professionals. How the starting discount is selected, however, needs to make sense. For example, if an analyst has compiled 10 CEFs as a market proxy for the subject holding company and there are no outliers in their discounts from NAV, it may be more appropriate to use an average instead of a median, as there are relatively few data points. On the other hand, if there are 80 funds in the relevant CEF group with numerous outliers, the median would likely provide the best starting point.
Adjusting from the starting point for quantitative and qualitative factors also needs to make sense. If there is a clear relationship between a quantitative factor and discounts from NAV, an analyst can use it to derive the appropriate DLOC. However, making adjustments to an average or median based on unclear quantitative relationships or qualitative factors can be tricky and compromise results. Ignoring these factors is just as risky, as it can give the analysis a superficial and incomplete appearance. Similar to almost everything else in the valuation world, it is important that the facts and circumstances in each case be carefully considered when adjusting from the median and average discounts indicated by the CEFs.
Helios Consulting can assist you with the valuation of investment holding companies. Our professionals have prepared hundreds of related valuation reports for trust and estate planning, internal planning, and tax restructuring purposes. Click to view our tax reporting & regulatory compliance valuation capabilities or contact us for a consultation.
Original article published by Business Valuation Resources, LLC can be accessed here.